Monitoring Air Quality
At Google Next 18, we worked with a group that had outfitting streetview vehicles with air quality sensors and collected pretty large dataset. Only covering Oakland and SF, the collection of timeseries coordinates was unwieldy enough to make analysis difficult. Using python and pandas with a mapping library called bokeh/hololens, we were able to get a sense of what the data looked like.
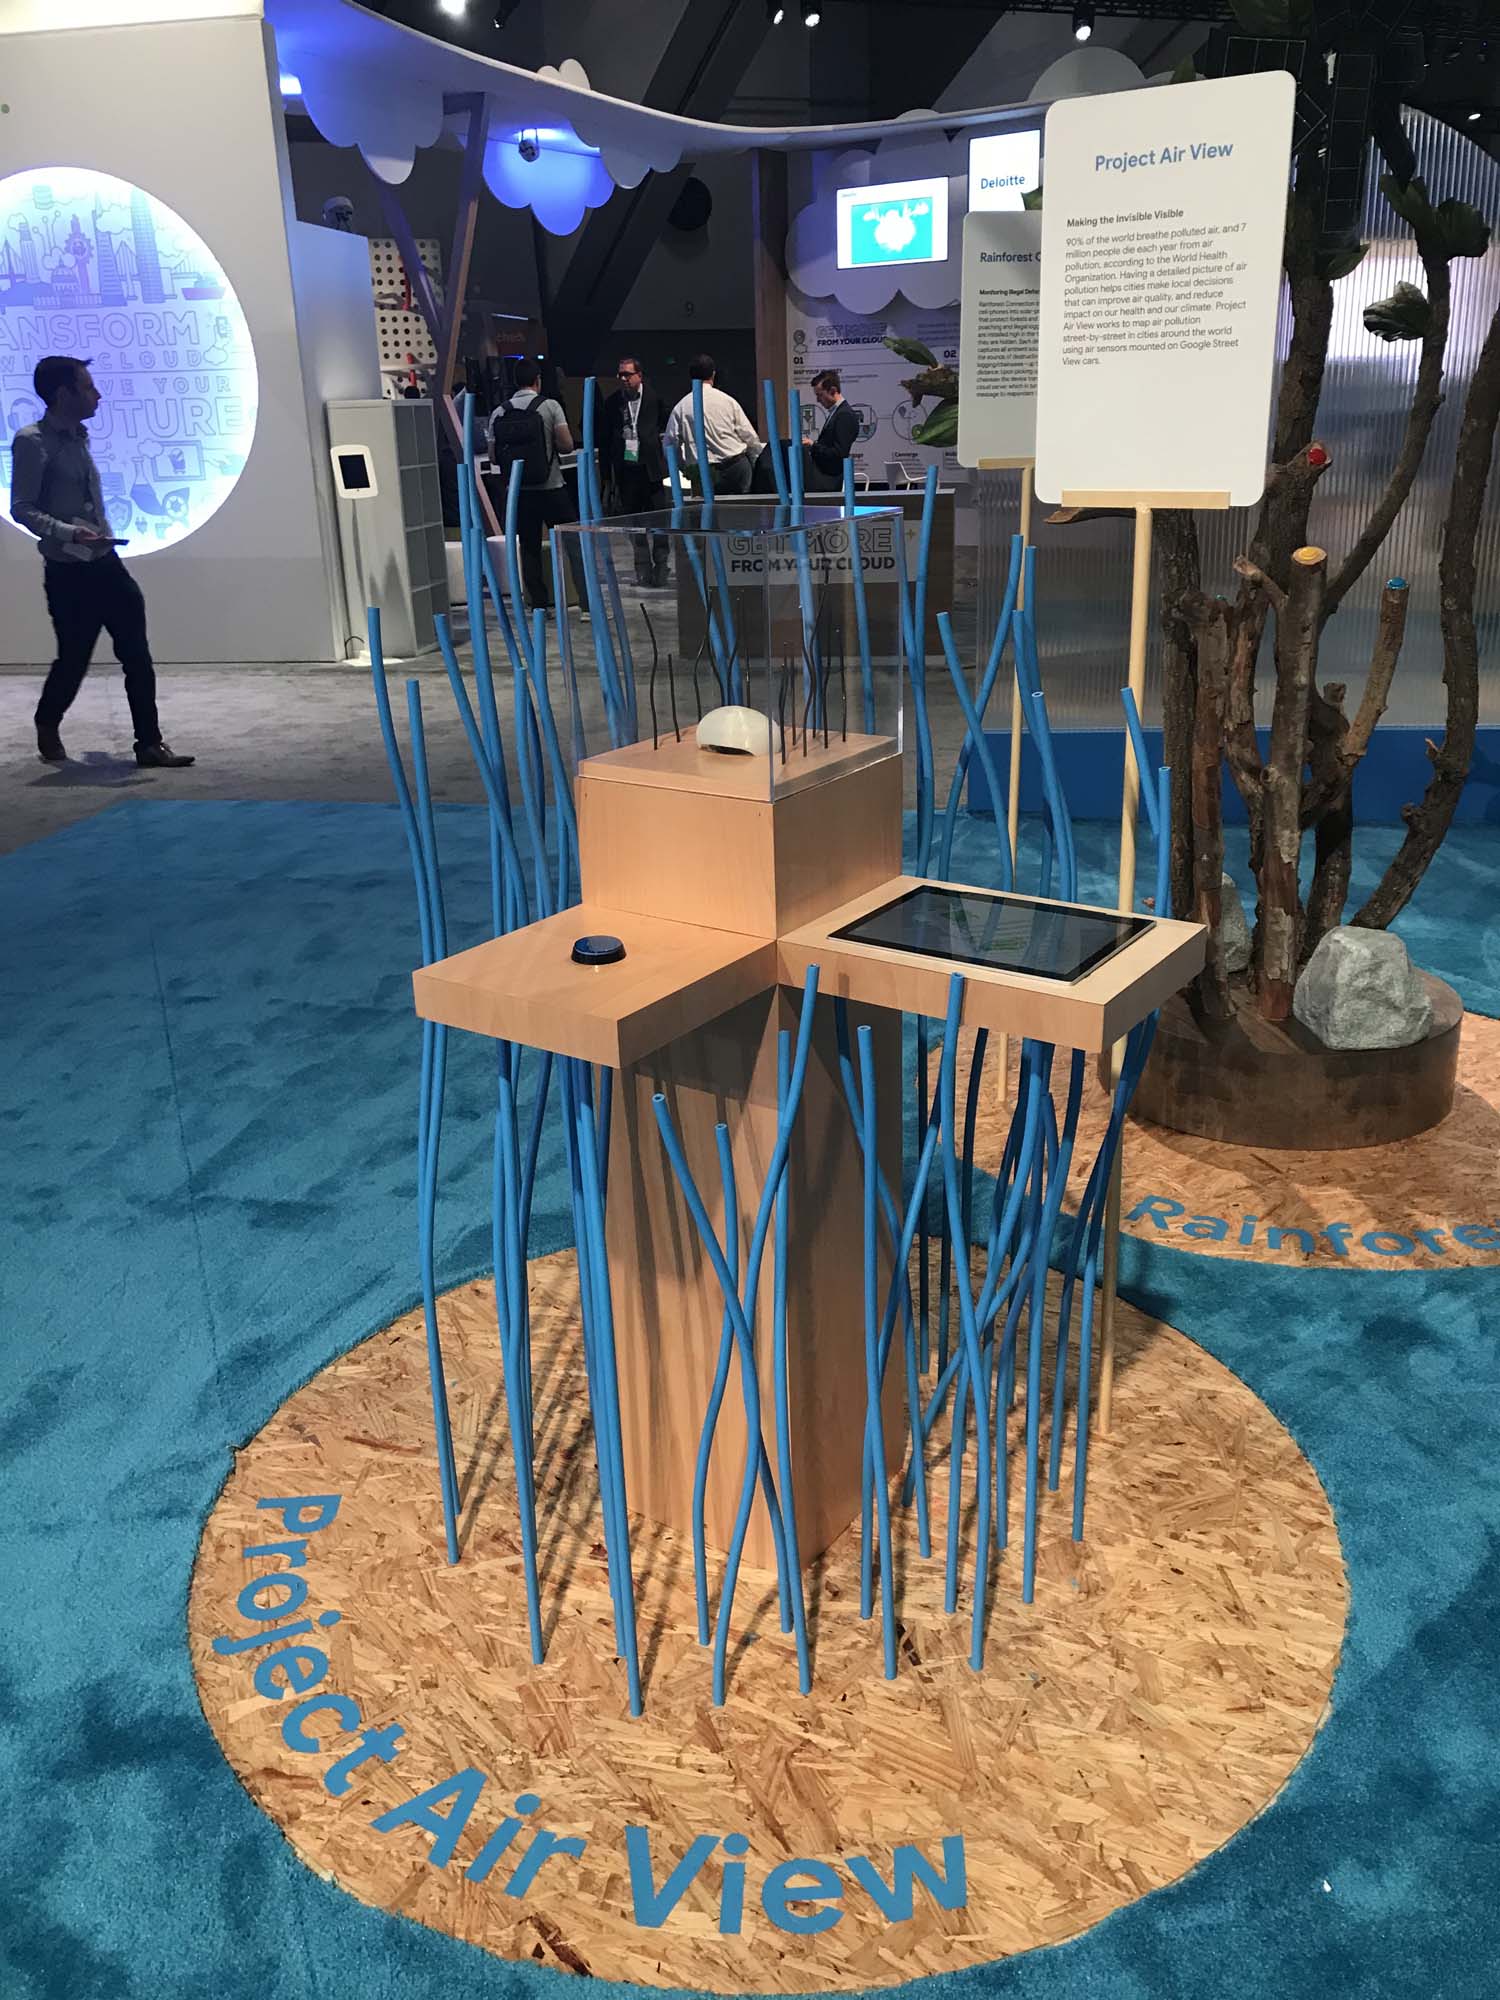
The decision to have a physical button power a fan that agitated air inside of a "smog box" (which turned out to be impossible to achieve, live and learn) had the goal of creating a visual representation of air pollution that's harder to see in the world at large. Because the button and the fan were controlled through a javascript interface, it made sense to refactor the python explorations into an actual front end. Using google maps and interpolating between unclustered heatmap layer as well as changing marker styles, we created a small vignette of Oakland that transitions from clean air records to more critical levels while the physical box fills with smoke.
Google, Purple Air
js
mapbox
devops